“Our engineering teams learn little to nothing when users complain ‘video is buggy’ or ‘video does not work.’”
That was the frustration shared by the CTO of a fast-growing creator app with over 300,000 daily active users.
To a user, the complaint is simple. To engineering, it’s almost unusable.
What failed?
- Was it content processing?
- A player regression?
- A CDN edge?
- A specific Android device?
- A network fluctuation?
Engineering teams don’t control networks or devices. But they get blamed anyway.
Once those complaints move from support tickets to public app reviews, it stops being a technical issue. It becomes a growth problem like retention drops, NRR weakens and acquisition gets harder.
Most video platforms hit this wall. They have logs. They have infrastructure monitoring. They have product analytics. What they don’t have is session-level visibility into what actually happened inside playback.
And without that, there’s no way to go back and understand where the experience broke.
This is where video data comes in. At a technical level, it shows what actually happened inside playback. Startup delays, buffering spikes, bitrate drops, player errors, crash correlation tied to real sessions instead of vague complaints.
But this isn’t just an engineering tool. When video is central to your product, playback quality directly impacts revenue.
- If startup time increases, engagement drops.
- If buffering creeps up, churn follows.
- If preview content fails, conversions suffer.
- If live streams lag, trust erodes.
Video data connects experience to outcomes. It shows which content actually holds attention. Which regions struggle. Which devices misbehave. Which audience segments stick around and which ghost you.
Instead of arguing in Slack about whether it’s the CDN, the player, or “just bad WiFi,” you see where technical quality intersects with retention, conversion, and growth.
And no, you don’t need to rebuild your stack. FastPix Data SDKs plug straight into players like Shaka, AVPlayer, and AndroidX Media3 and more… They integrate to your existing playback events and start streaming structured session data in minutes.
You can just keep building. Now you just know what’s really happening. Which is surprisingly rare in video.
TL;DR
When users say “video is buggy,” it’s almost impossible for engineering teams to know what actually went wrong without session-level visibility. This article explains how video data reveals real playback issues like startup delays, buffering, device-specific failures, and release regressions and how those insights connect directly to retention, revenue, and growth. With tools like FastPix Video Data, teams can capture structured playback data in minutes and finally understand what’s really happening inside video sessions.
So what metrics are we actually talking about here?
Not surface-level analytics. The metrics that tell you whether playback quality is affecting retention, revenue, and system stability.
But raw metrics alone don’t solve daily complaints. The value comes from understanding how those signals translate into decisions, what to fix, what to prioritize, and what to ignore.
That’s why we’ve structured this into two clear sections: business impact and technical insight. One helps you understand how video performance influences growth and retention. The other helps you isolate regressions, performance bottlenecks, and release risks.
Below is the set of metrics we track.
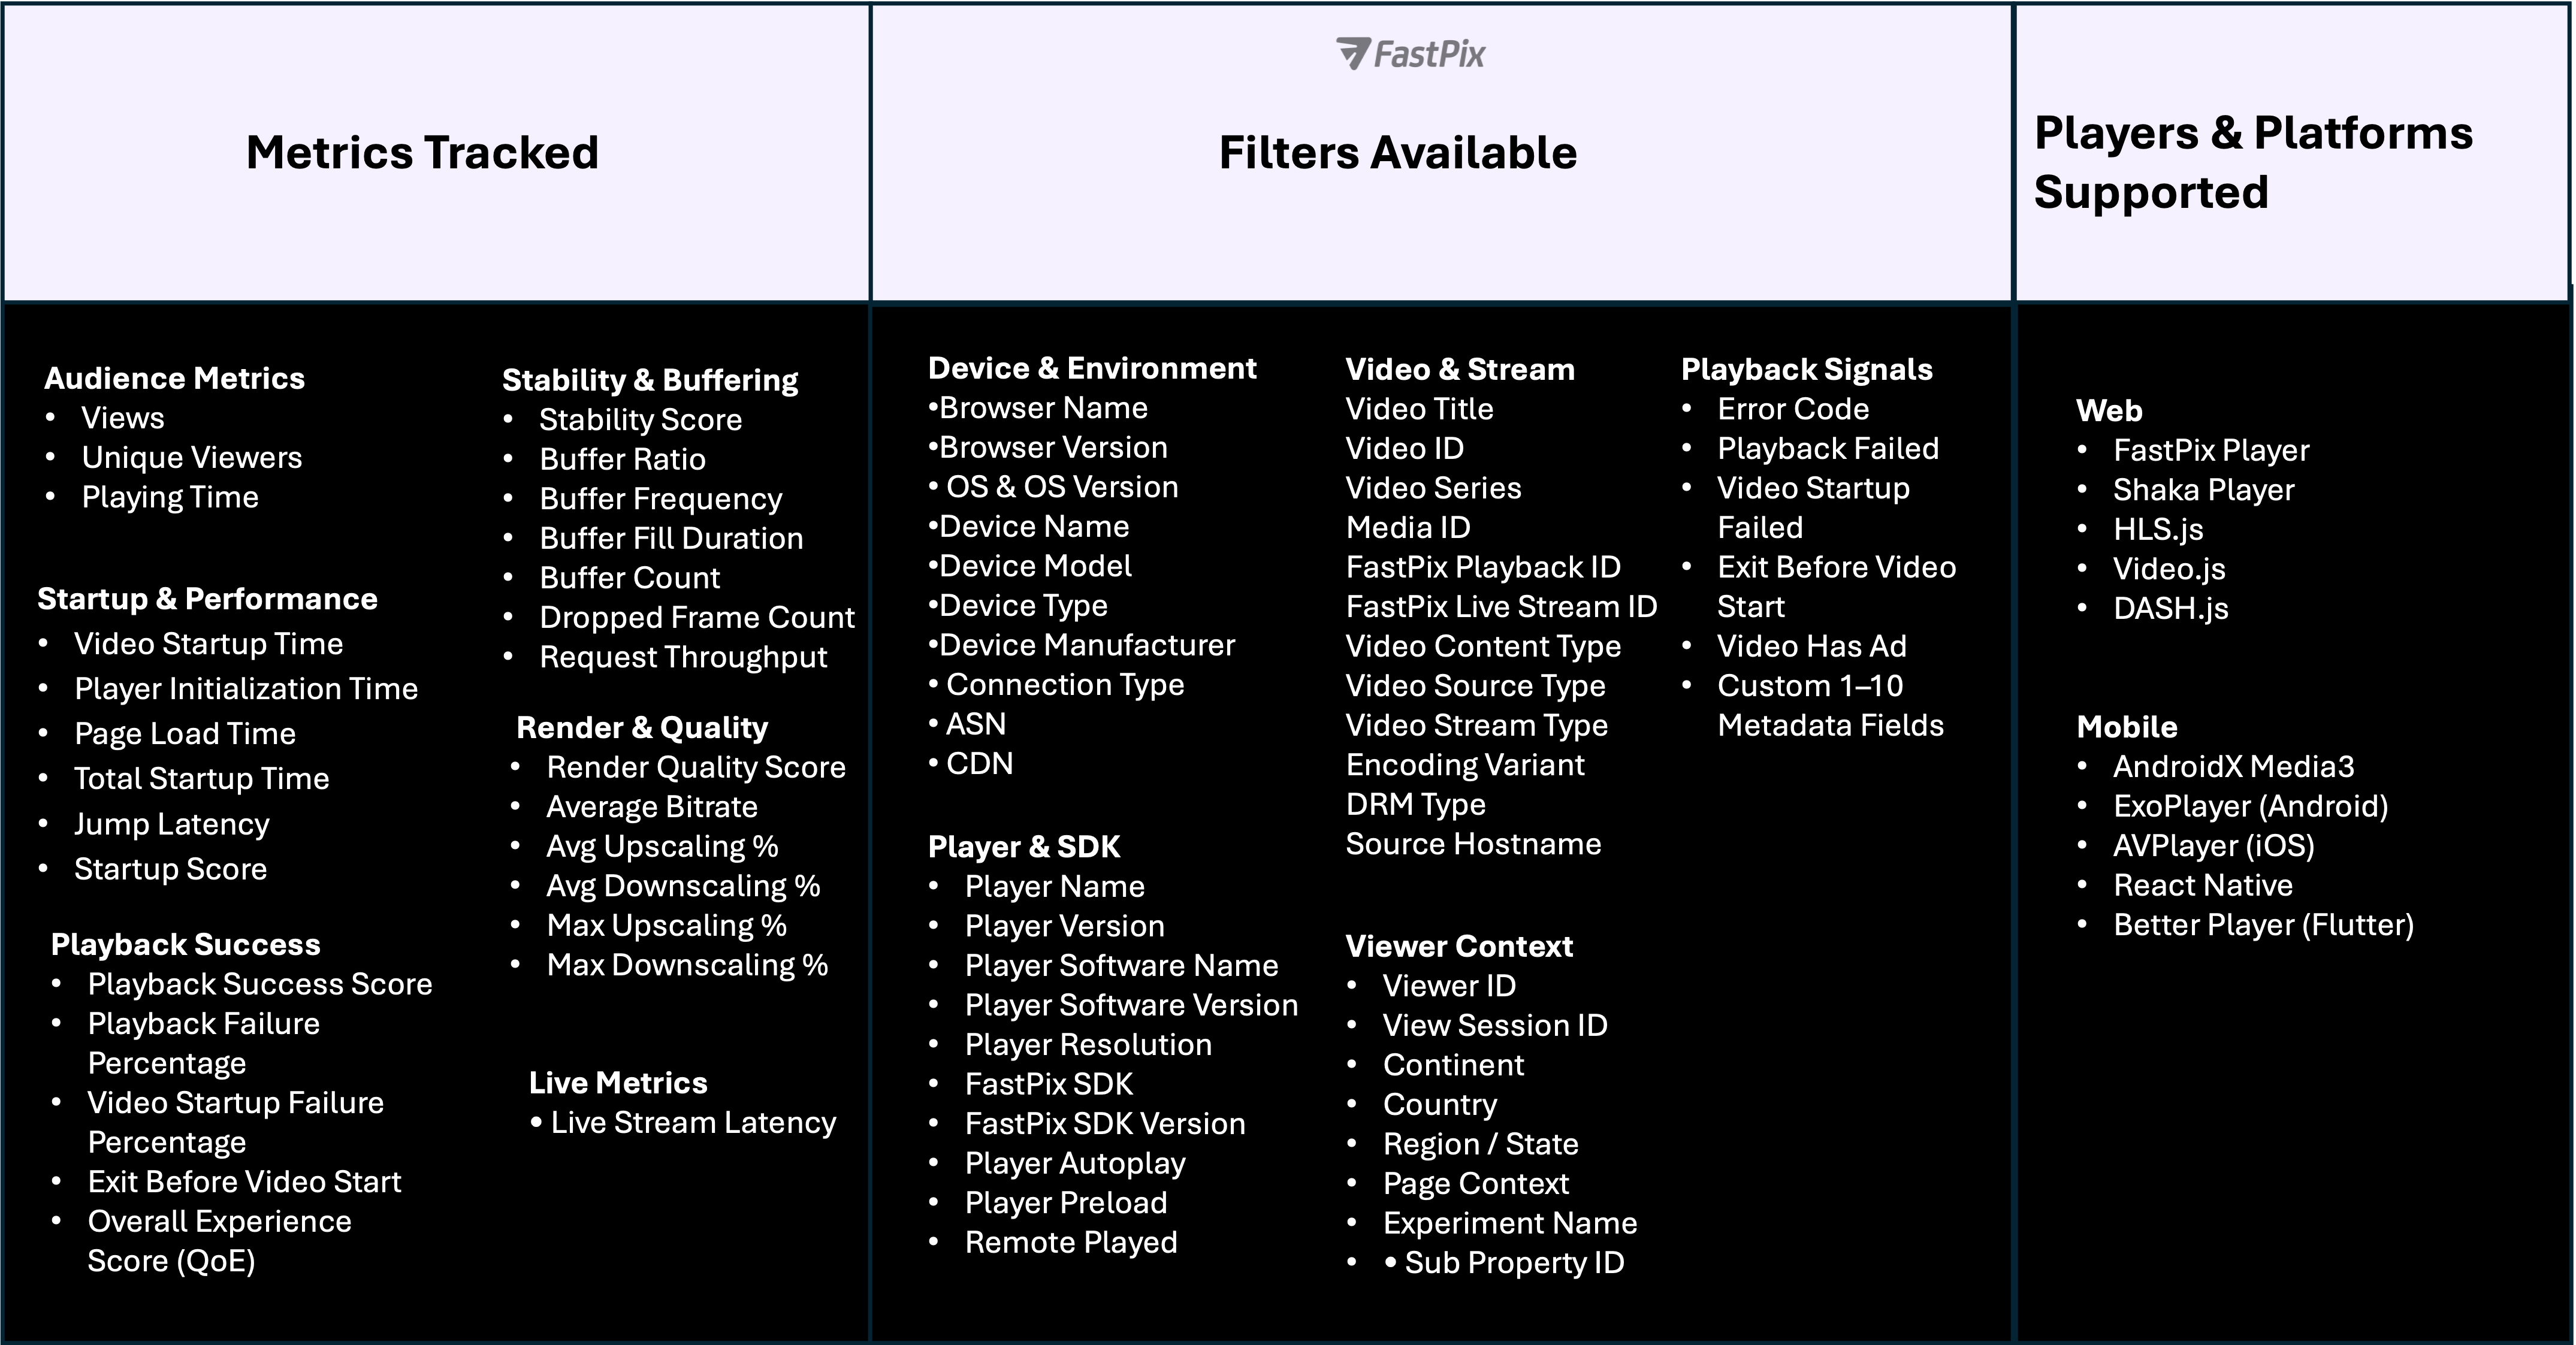
Note: We track more than 50+ metrics, refer to our docs on What Video Data do we capture to get the full picture of it.
Now let’s connect those metrics directly to the decisions you need to make.
How Video Data Shape Business Decisions
When video plays a direct role in revenue, view counts alone don’t give the full picture.
Views tell you that someone clicked play. They don’t show whether learners stayed engaged, returned later, or found enough value to continue. Relying only on view counts makes it harder to understand what’s truly working and where improvement will have the biggest impact.
Let start with one example with the dashboard:
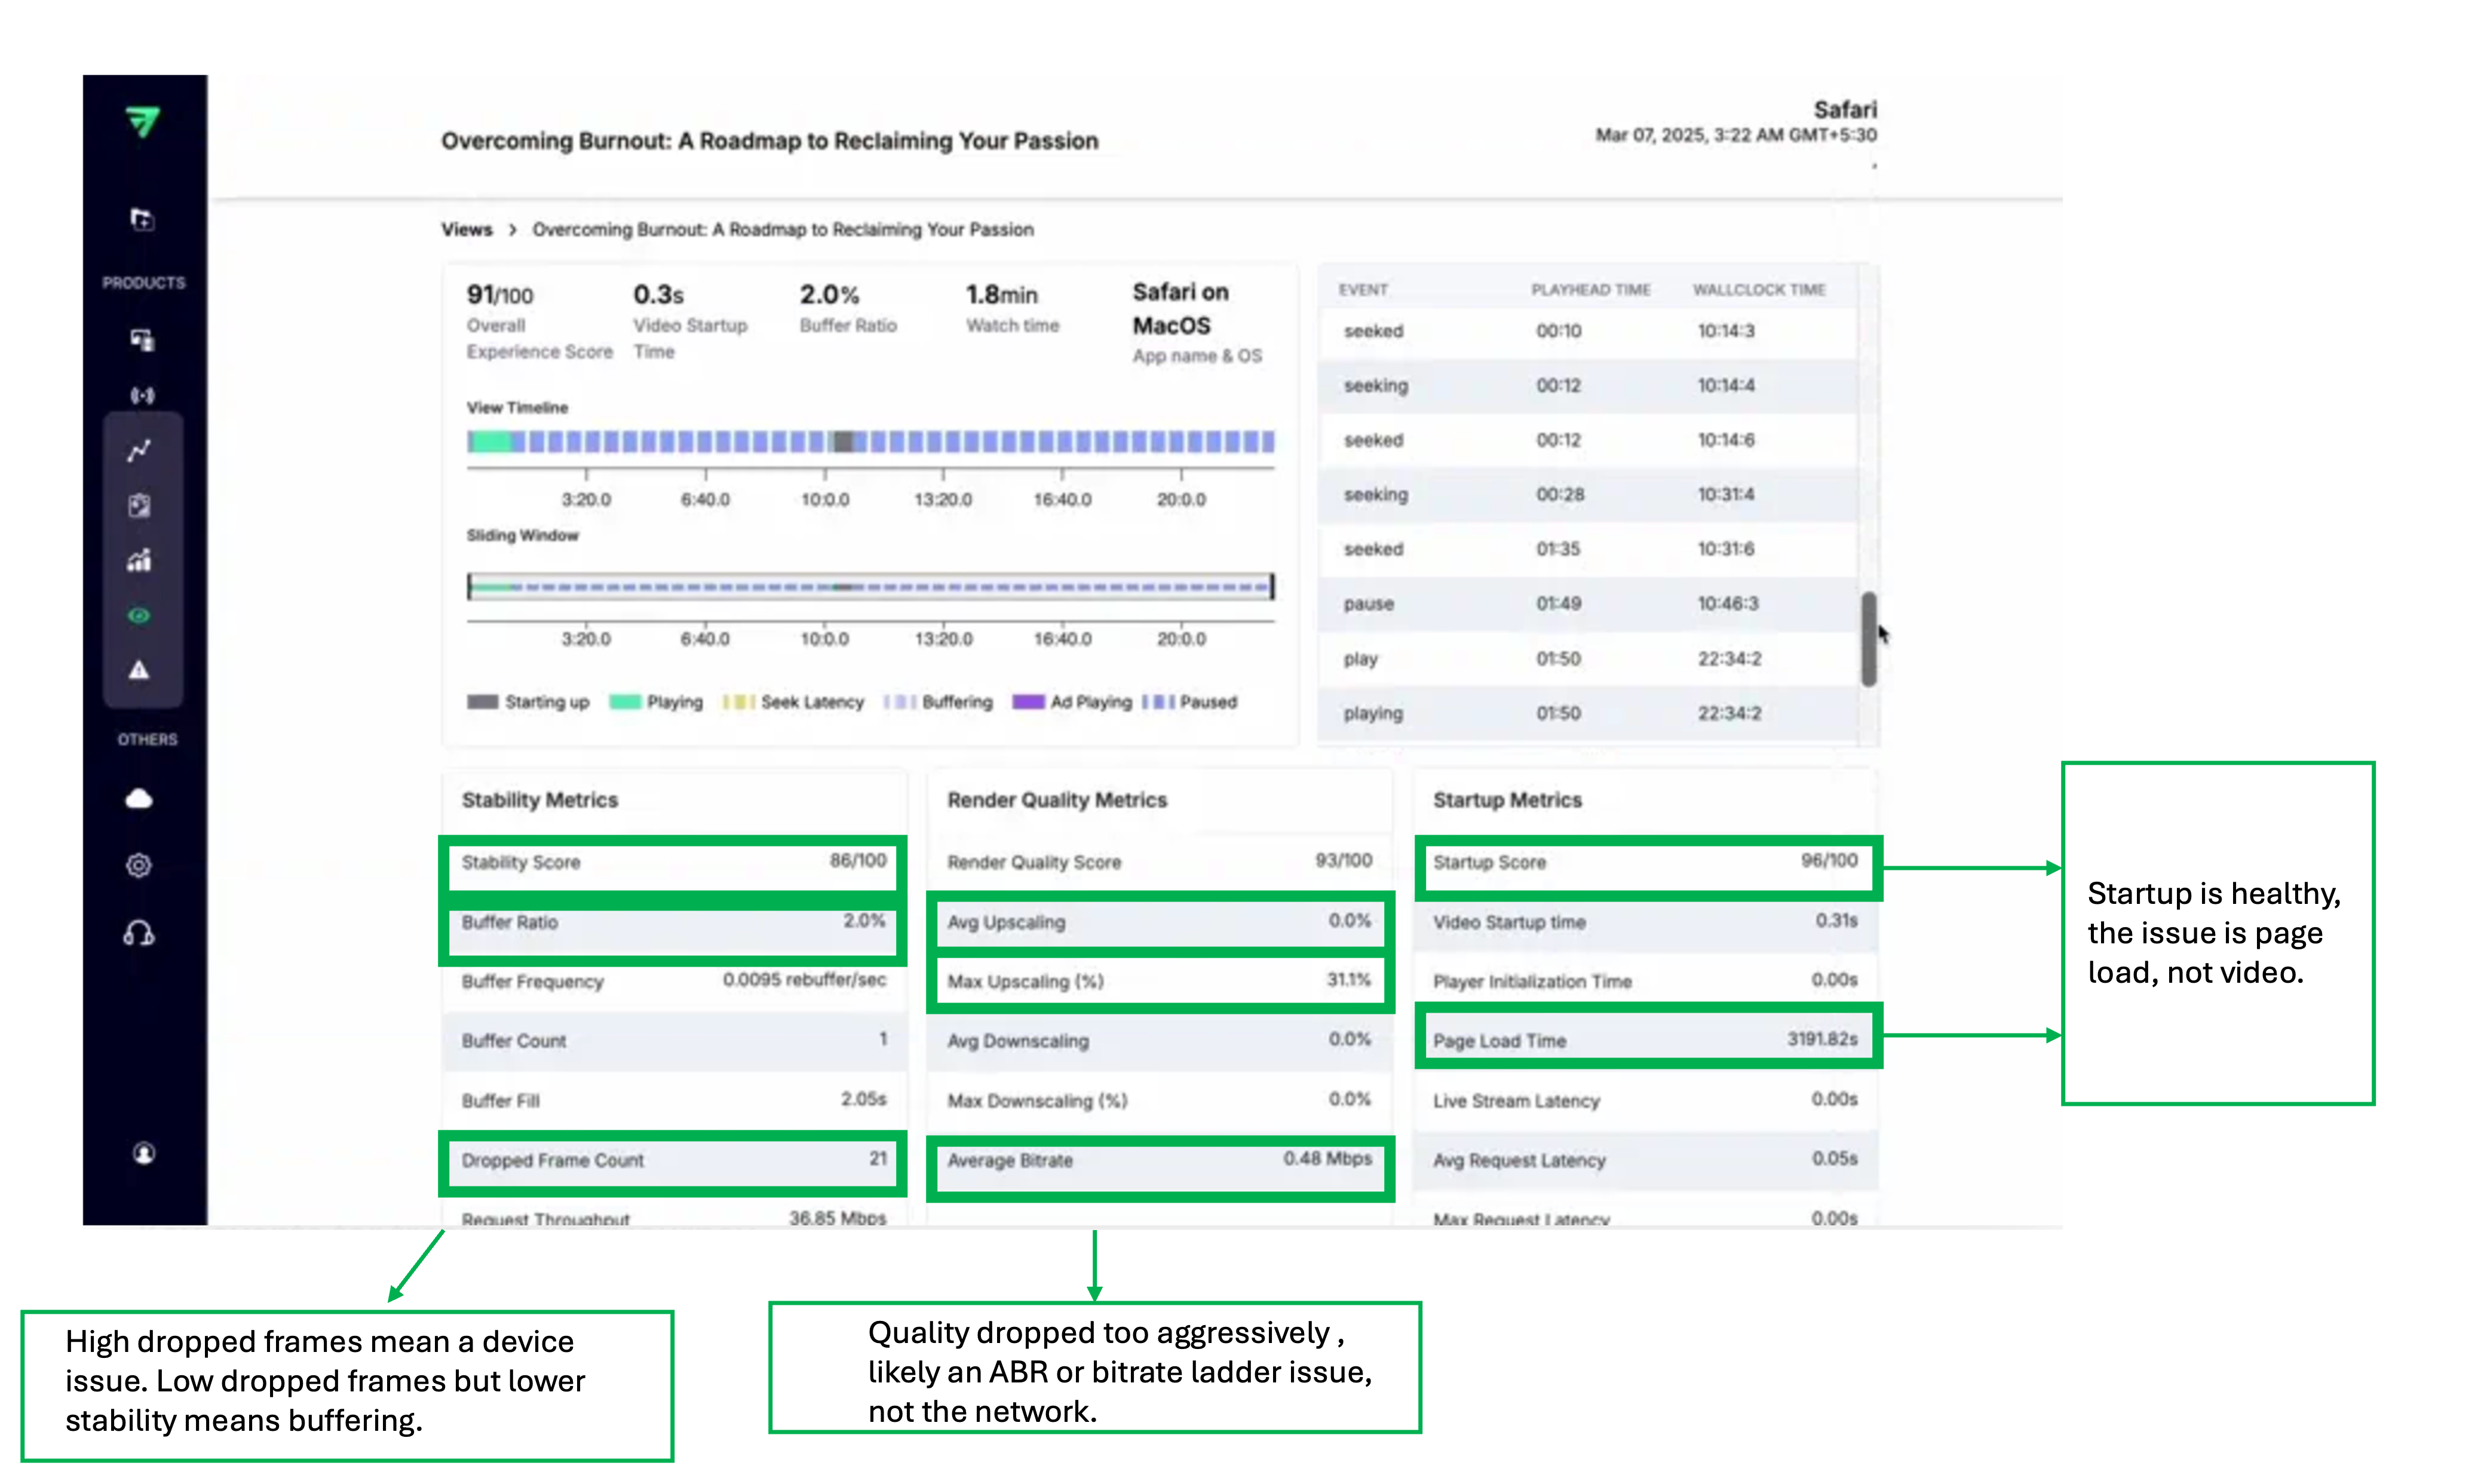
Look at how just a few metric pairs and the story becomes clear.
Startup Score is high and Video Startup Time is fast, but Page Load Time is heavy. That tells you immediately the delay isn’t video delivery. The player is fine. The page is slow.
Average Bitrate is low while Max Upscaling spikes. That means quality droppedand had to be stretched back up. This points to ABR or bitrate ladder tuning, not bad networks.
Stability Score dips with dropped frames present. That suggests device-side rendering pressure, not just buffering.
Just a few metrics, read together, already explain what’s happening.
Now let’s look at more scenarios and see how video data helps in each one. To make it clearer, we’ve grouped them into focused sub-categories.
1. Engagement & Retention
These questions tell you whether viewers are staying or quietly leaving.
| Business Question | FastPix Metrics to Analyze | What This Helps You Decide |
|---|---|---|
| Which videos truly hold attention? | playing_time, view_completed, views | Which content to promote more and which to deprioritize |
| Are users finishing videos? | view_completed, exit_before_video_start | Whether drop-offs are content-driven or startup friction |
| Are we attracting new viewers or retaining existing ones? | views, unique_viewers | Whether growth is repeat consumption or one-time traffic |
| Is startup friction hurting engagement? | video_startup_time, video_startup_failure_percentage | Whether improving startup speed will increase retention |
| Is buffering reducing session duration? | buffer_ratio, buffer_count, stability_score | Whether QoE issues are shortening sessions |
2. Monetization & Conversion
If video drives revenue, performance directly affects income.
| Business Question | FastPix Metrics to Analyze | What This Helps You Decide |
|---|---|---|
| Is playback failure affecting revenue? | playback_failure_percentage, playback_score | Whether failed sessions are costing paying users |
| Are startup delays hurting premium experience? | startup_score, video_startup_time | Whether faster startup can improve paid user satisfaction |
| Are ads damaging experience? | video_has_ad, buffer_ratio, stability_score | Whether ad load needs tuning to protect retention |
| Are live events delivering reliably? | live_stream_latency, buffer_ratio | Whether infrastructure can support revenue-driving live sessions |
| Are quality drops impacting value perception? | average_bitrate, avg_downscaling | Whether encoding strategy affects perceived quality |
3. User Experience & Product Quality
Where product and engineering intersect.
| Business Question | FastPix Metrics to Analyze | What This Helps You Decide |
|---|---|---|
| Why does video look blurry? | average_bitrate, max_upscaling | Whether ABR tuning or encoding ladder needs adjustment |
| Why does playback feel unstable? | stability_score, buffer_ratio | Whether instability is network or client-side |
| Are users exiting before playback starts? | exit_before_video_start, video_startup_failure_percentage | Whether startup friction is blocking engagement |
| Is quality degrading mid-session? | avg_downscaling, buffer_fill | Whether bitrate strategy is too aggressive |
| Are dropped frames impacting playback? | dropped_frame_count | Whether device-level optimization is needed |
4. Release Risk & Operational Stability
This prevents small issues from becoming public complaints.
| Business Question | FastPix Metrics to Analyze | What This Helps You Decide |
|---|---|---|
| Did a release degrade playback? | startup_score, stability_score (filtered by player_version) | Whether to roll back or hotfix a release |
| Are errors concentrated in specific environments? | error_code, os_name, device_model | Whether the issue is platform-specific |
| Is buffering isolated or systemic? | buffer_ratio filtered by ASN, CDN | Whether the problem is infrastructure or user network |
| Is one CDN underperforming? | buffer_ratio by cdn | Whether to reroute traffic |
| Are bitrate drops happening on stable networks? | avg_downscaling, connection_type | Whether ABR logic needs tuning |
5. Infrastructure & Distribution Efficiency
Where video data becomes strategic, not reactive.
| Business Question | FastPix Metrics to Analyze | What This Helps You Decide |
|---|---|---|
| Are we over-delivering bitrate? | average_bitrate, avg_upscaling | Whether encoding ladder can be optimized to reduce cost |
| Are certain regions consistently degraded? | country, buffer_ratio | Whether to improve regional delivery |
| Is mobile startup slower than desktop? | video_startup_time by device_type | Whether mobile performance needs prioritization |
| Are specific variants unstable? | video_encoding_variant, playback_failure_percentage | Whether to refine encoding profiles |
| Is traffic growth exposing weaknesses? | startup_time, buffer_ratio over time | Whether infrastructure scaling is required |
Customize your business metrics
Beyond standard video metrics, FastPix Video Data can be tailored around what you actually care about. Along with standard playback signals, teams can add their own business context to each video session and filter the data around the things that matter most. FastPix lets you enrich each session with platform-specific metadata.
Below are examples across industries.
1. By User Segment
| Customization Dimension | Example Fields (Video Business) | What This Helps You Decide |
|---|---|---|
| Viewer tier | free / premium / VIP | Whether premium users are getting a better experience than free users |
| Audience type | new_user / returning_user / subscriber | If playback issues are affecting retention |
| Buyer persona | student / instructor / viewer / creator | Which user groups face the most playback friction |
| Enterprise account | reseller_id / partner_id | Whether specific partners are seeing more quality issues |
2. By Monetization Model
| Customization Dimension | Example Fields | What This Helps You Decide |
|---|---|---|
| Revenue type | subscription / ads / PPV | If ads or paywalls are increasing buffering or exits |
| Campaign ID | campaign_code | Whether paid traffic lands on a stable video experience |
| Content paywall | preview / full_access | If preview performance affects conversion to paid |
| Revenue share partner | creator_id / instructor_id | Whether top revenue contributors are impacted by QoE issues |
3. By Geography & Distribution
| Customization Dimension | Example Fields | What This Helps You Decide |
|---|---|---|
| Region | country / state | Which markets need delivery improvements |
| ISP / ASN | network_provider | If certain networks cause repeated buffering |
| CDN routing | primary / backup / reseller_cdn | Whether routing strategy affects stability |
| Language stream | dubbed / localized | If localized streams perform differently |
4. By Content & Publisher
| Customization Dimension | Example Fields | What This Helps You Decide |
|---|---|---|
| Creator / Instructor | creator_id / instructor_id | If specific creators are losing viewers due to playback issues |
| Content type | live / VOD / short-form | Which formats are more sensitive to performance issues |
| Event ID | match_id / webinar_id | If live events need extra performance monitoring |
| Series / season | season_id | Where viewers drop across episodic content |
5. By Release & Engineering Rollout
| Customization Dimension | Example Fields | What This Helps You Decide |
|---|---|---|
| App version | build_number | If a release introduced startup delays or errors |
| Player version | sdk_version | Whether a player update caused regressions |
| Encoding profile | ladder_id | If bitrate changes improved or hurt performance |
| Feature flag | experiment_group | If an experiment degraded playback quality |
Now let’s move to the engineering section.
How Video Data Helps with Technical Insights
At scale, video issues are rarely clean or obvious. Playback might work on one device and fail on another. It may start instantly in some regions and stall in others. Quality can degrade mid-session or crashes can appear only on specific app versions
This is what makes video hard to operate in production. The system is distributed by nature spanning players, devices, networks, CDNs, and backend services and failures tend to affect only slices of traffic.
Because of that, engineering teams don’t debate on overall availability. They focus on understanding where the experience breaks, for whom, and under what conditions.
They ask questions like these.
1. Session-Level Visibility
When complaints are vague and logs aren’t enough.
| What Teams Face | FastPix Metrics | What This Helps You Understand |
|---|---|---|
| “It works for us, but users complain.” | view_session_id, playback_failure_percentage, error_code | Exactly which sessions failed and the error behind them |
| Black screen, no clear logs | video_startup_failure_percentage, exit_before_video_start | Whether playback failed before the first frame |
| Are crashes actually video-related? | playback_failure_percentage, error_code (filtered by session) | Whether failure occurred during active playback |
| Resume works on one device but not another | view_session_id, device_model, os_name | Whether the issue is isolated to specific environments |
2. Performance & QoE
Where startup delay, buffering, and quality issues hide.
| What Teams Face | FastPix Metrics | What This Helps You Understand |
|---|---|---|
| Is buffering everywhere or isolated? | buffer_ratio, buffer_count (filtered by ASN, CDN, country) | Whether buffering is network-, region-, or infrastructure-specific |
| Video starts fast on desktop but slow on mobile | video_startup_time filtered by device_type | Platform-level startup differences |
| Video suddenly drops to low quality | average_bitrate, avg_downscaling, max_downscaling | Whether bitrate dropped due to ABR or throughput instability |
| Playback feels unstable | stability_score, buffer_frequency | Whether interruptions are frequent enough to impact experience |
3. Device & Platform Fragmentation
Where scale introduces complexity.
| What Teams Face | FastPix Metrics | What This Helps You Understand |
|---|---|---|
| Is this issue device-specific? | device_model, device_type, playback_failure_percentage | Whether failures cluster around certain devices |
| Why does one OS version struggle more? | os_name, os_version, video_startup_time | OS-level performance differences |
| Is this network-related? | connection_type, asn_name, buffer_ratio | Whether user network conditions are the root cause |
| Is this region-specific? | country, region, buffer_ratio | Geographic patterns in degradation |
4. Release & Regression Control
Where things quietly break after deployment.
| What Teams Face | FastPix Metrics | What This Helps You Understand |
|---|---|---|
| Did this release degrade playback? | player_version, fp_sdk_version, startup_score, stability_score | Whether performance dropped after a player or SDK update |
| Are errors concentrated in one version? | player_version, error_code | Version-specific regression |
| Did encoding changes impact quality? | video_encoding_variant, average_bitrate, avg_upscaling | Whether new variants introduced instability |
| Did infrastructure changes affect startup? | cdn, video_startup_time | Whether delivery routing altered performance |
5. Live & Real-Time Stability
Where problems become public quickly.
| What Teams Face | FastPix Metrics | What This Helps You Understand |
|---|---|---|
| Live streams feel laggy | live_stream_latency, buffer_ratio | Whether latency or buffering is degrading live sessions |
| Drop-offs during peak events | playing_time, view_completed (filtered by time window) | Whether viewers abandon during load spikes |
| Is CDN struggling under load? | cdn, buffer_ratio, video_startup_time | Whether delivery degrades under traffic |
| Sudden quality drop during live | avg_downscaling, average_bitrate | Whether bitrate instability increases during concurrency |
Customize your technical metrics
Just like business teams tailor video data to answer questions about engagement and revenue, engineering teams can do the same on the technical side. Instead of relying only on generic playback metrics, FastPix lets teams attach technical context that reflects how their system is actually built and deployed.
On the technical side, teams commonly customize video data with things like app version, build number, player version, CDN or delivery path, or even specific backend services involved in playback. Once this context is attached, engineers can slice video performance by release, rollout, or infrastructure change and immediately see what’s affected.
This makes it possible to answer questions engineers care about during real incidents.
How Easy It Is to Get Video Data Live with FastPix
FastPix Video Data is built for teams that don’t want a long setup story. Most teams get the Data SDK wired up in about an hour across Shaka,AVPlayer,andAndroidX Media3 (we support several other players as well), without heavy rewrites or changes to their existing playback stack.
Once the data starts flowing, teams stop debating where video might be breaking. They can see exactly when and where issues show up by device, network, player version, or release which makes it far easier to decide what to fix first and what to safely ignore.
The real advantage isn’t just how fast the setup is. Within the first hour, data starts showing up in the dashboard, and teams can see how video is actually behaving in the wild.
To know more on supported players and detailed setup steps, the FastPix documentation has everything laid out.