Microdrama apps now command more daily mobile viewing time per US user than the three largest streamers combined (Omdia, 2026). Global microdrama revenue hit $11 billion in 2025 and is on track for $14 billion by the end of 2026.
So a lot of teams are looking at the format and asking the obvious question. If both OTT and microdrama are "video streaming," can we run them on the same infrastructure and call it a day?
The answer is no. They look like the same workload from the outside. The cost stacks tell a very different story. One bills you for bandwidth. The other bills you for events. Same monthly active users, very different invoices.
TL;DR
Microdrama and OTT are structurally different infrastructure problems even though both deliver video. OTT is a bandwidth problem: a few thousand long titles, one or two long viewing sessions per user, and delivery dominates the bill. Microdrama is a request-volume problem: tens of thousands of 60-second clips, 30 plus swipes per session, and per-view events crush the analytics line. Pricing models built for OTT silently overcharge microdrama by 2 to 5 times. Any platform that hands you one rate card for both workloads is making one of the two pay for the other. Price them separately, or you will lose money.
The two scenarios we're pricing
To make this concrete, we built two reference workloads at the same monthly active user count. The shape of consumption is the variable, not the audience size.
| Workload | Catalog | Avg asset length | MAU | Watch pattern |
|---|---|---|---|---|
| OTT | 5,000 titles | 90 min | 1,000,000 | 8 hrs/month, 1-2 long sessions |
| Microdrama | 50,000 clips | 75 sec | 1,000,000 | 30 sessions/month, 25 swipes per session |
Both workloads pull from the same core stack: ingest, encode, store, deliver, measure. Where they diverge is how often each layer gets touched, and which line item ends up dominating the invoice at the end of the month.
The headline cost comparison
Below is the monthly cost stack for both workloads at 1 million MAU. FastPix unit prices come from public pricing. Storage and per-view analytics rates above the free tier are estimated and flagged in Suggestions for Human Review.
| Line item | OTT (1M MAU) | Microdrama (1M MAU) | What drives the gap |
|---|---|---|---|
| Encoding (catalog refresh) | ~6,750 min, ~$200 | ~30,000 min, ~$900 | 10x more files to encode |
| Storage | High retention, multi-year | 14-day hot window, then cold | OTT keeps everything hot for years |
| Delivery (minutes) | ~480M min | ~500M min | Surprisingly similar at this MAU |
| Delivery cost @ $0.00096/min | ~$461,000 | ~$480,000 | Bandwidth is roughly even |
| View events generated | ~30M | ~750M | 25x more discrete view events |
| Analytics overhead | Within most free tiers | Crushes per-view billing | Every swipe fires a new event |
| Player + manifest requests | ~30M/month | ~750M/month | Each clip is a fresh playback session |
| Bill shape | Bandwidth-led | Event-led |
The two totals can land within shouting distance of each other in raw dollars. The composition is what should worry you. OTT spend pools into delivery. Microdrama spend pools into events and requests. Any vendor that bundles those two line items into a single per-MAU price is taking sides.
Why the two workloads cost different things
Six structural differences drive the gap. Here they are at a glance, then we walk through each.
| Dimension | OTT pattern | Microdrama pattern |
|---|---|---|
| Catalog size | Thousands of long titles | Tens of thousands of 60-90s clips |
| Encoding strategy | Per-title, multi-pass, premium ladders | Batch single-pass at scale |
| Delivery pattern | 1-2 long sessions per user | 30+ swipes per session |
| Player and analytics focus | Quality scores, rebuffering | Completion rate, scroll velocity |
| Storage hot window | Years (long tail) | 7-14 days |
| Live streaming surface | Often present | Almost never |
Catalog and storage: long tail vs cold rotation
OTT keeps its catalog hot for years. A title released in 2018 still pulls views in 2026. The library grows slowly but never shrinks, and storage costs compound month after month.
Microdrama runs on a 7 to 14 day hot window. A clip drops, gets pushed through the recommendation feed for two weeks, then falls off a cliff. Most platforms move clips to cold storage or delete them entirely after the window closes.
| Metric | OTT (5K titles) | Microdrama (50K clips) |
|---|---|---|
| Total catalog hours | ~7,500 | ~1,000 |
| Hot storage share | ~95% (everything stays hot) | ~10-15% (rolling window) |
| Cold storage share | ~5% | ~85-90% |
| Net storage bill | High and growing | Lower and capped |
Encoding strategy: per-title premium vs batch single-pass
OTT teams pay for premium encoding because long titles get watched on TVs. Multi-pass encodes, per-title ladders, and HEVC outputs are standard. The encode is expensive, but it amortizes across thousands of viewing hours per title.
Microdrama teams cannot afford this math. With 50,000 clips and a 14-day shelf life, the per-clip viewing hours are too small to justify a premium encode. Batch single-pass at the lowest acceptable bitrate is the only economical choice. Context-aware encoding helps cut bitrate further without hurting perceived quality on a phone screen.
| Metric | OTT | Microdrama |
|---|---|---|
| Catalog refresh per month (~5%) | ~6,750 min | ~30,000 min |
| Encode cost @ $0.03/min | ~$200 | ~$900 |
| Encoding strategy | Multi-pass, per-title | Batch single-pass with CAE |
| Encode cost per viewing hour | Low (amortized across years) | Higher (short shelf life) |
Delivery: bandwidth vs request volume
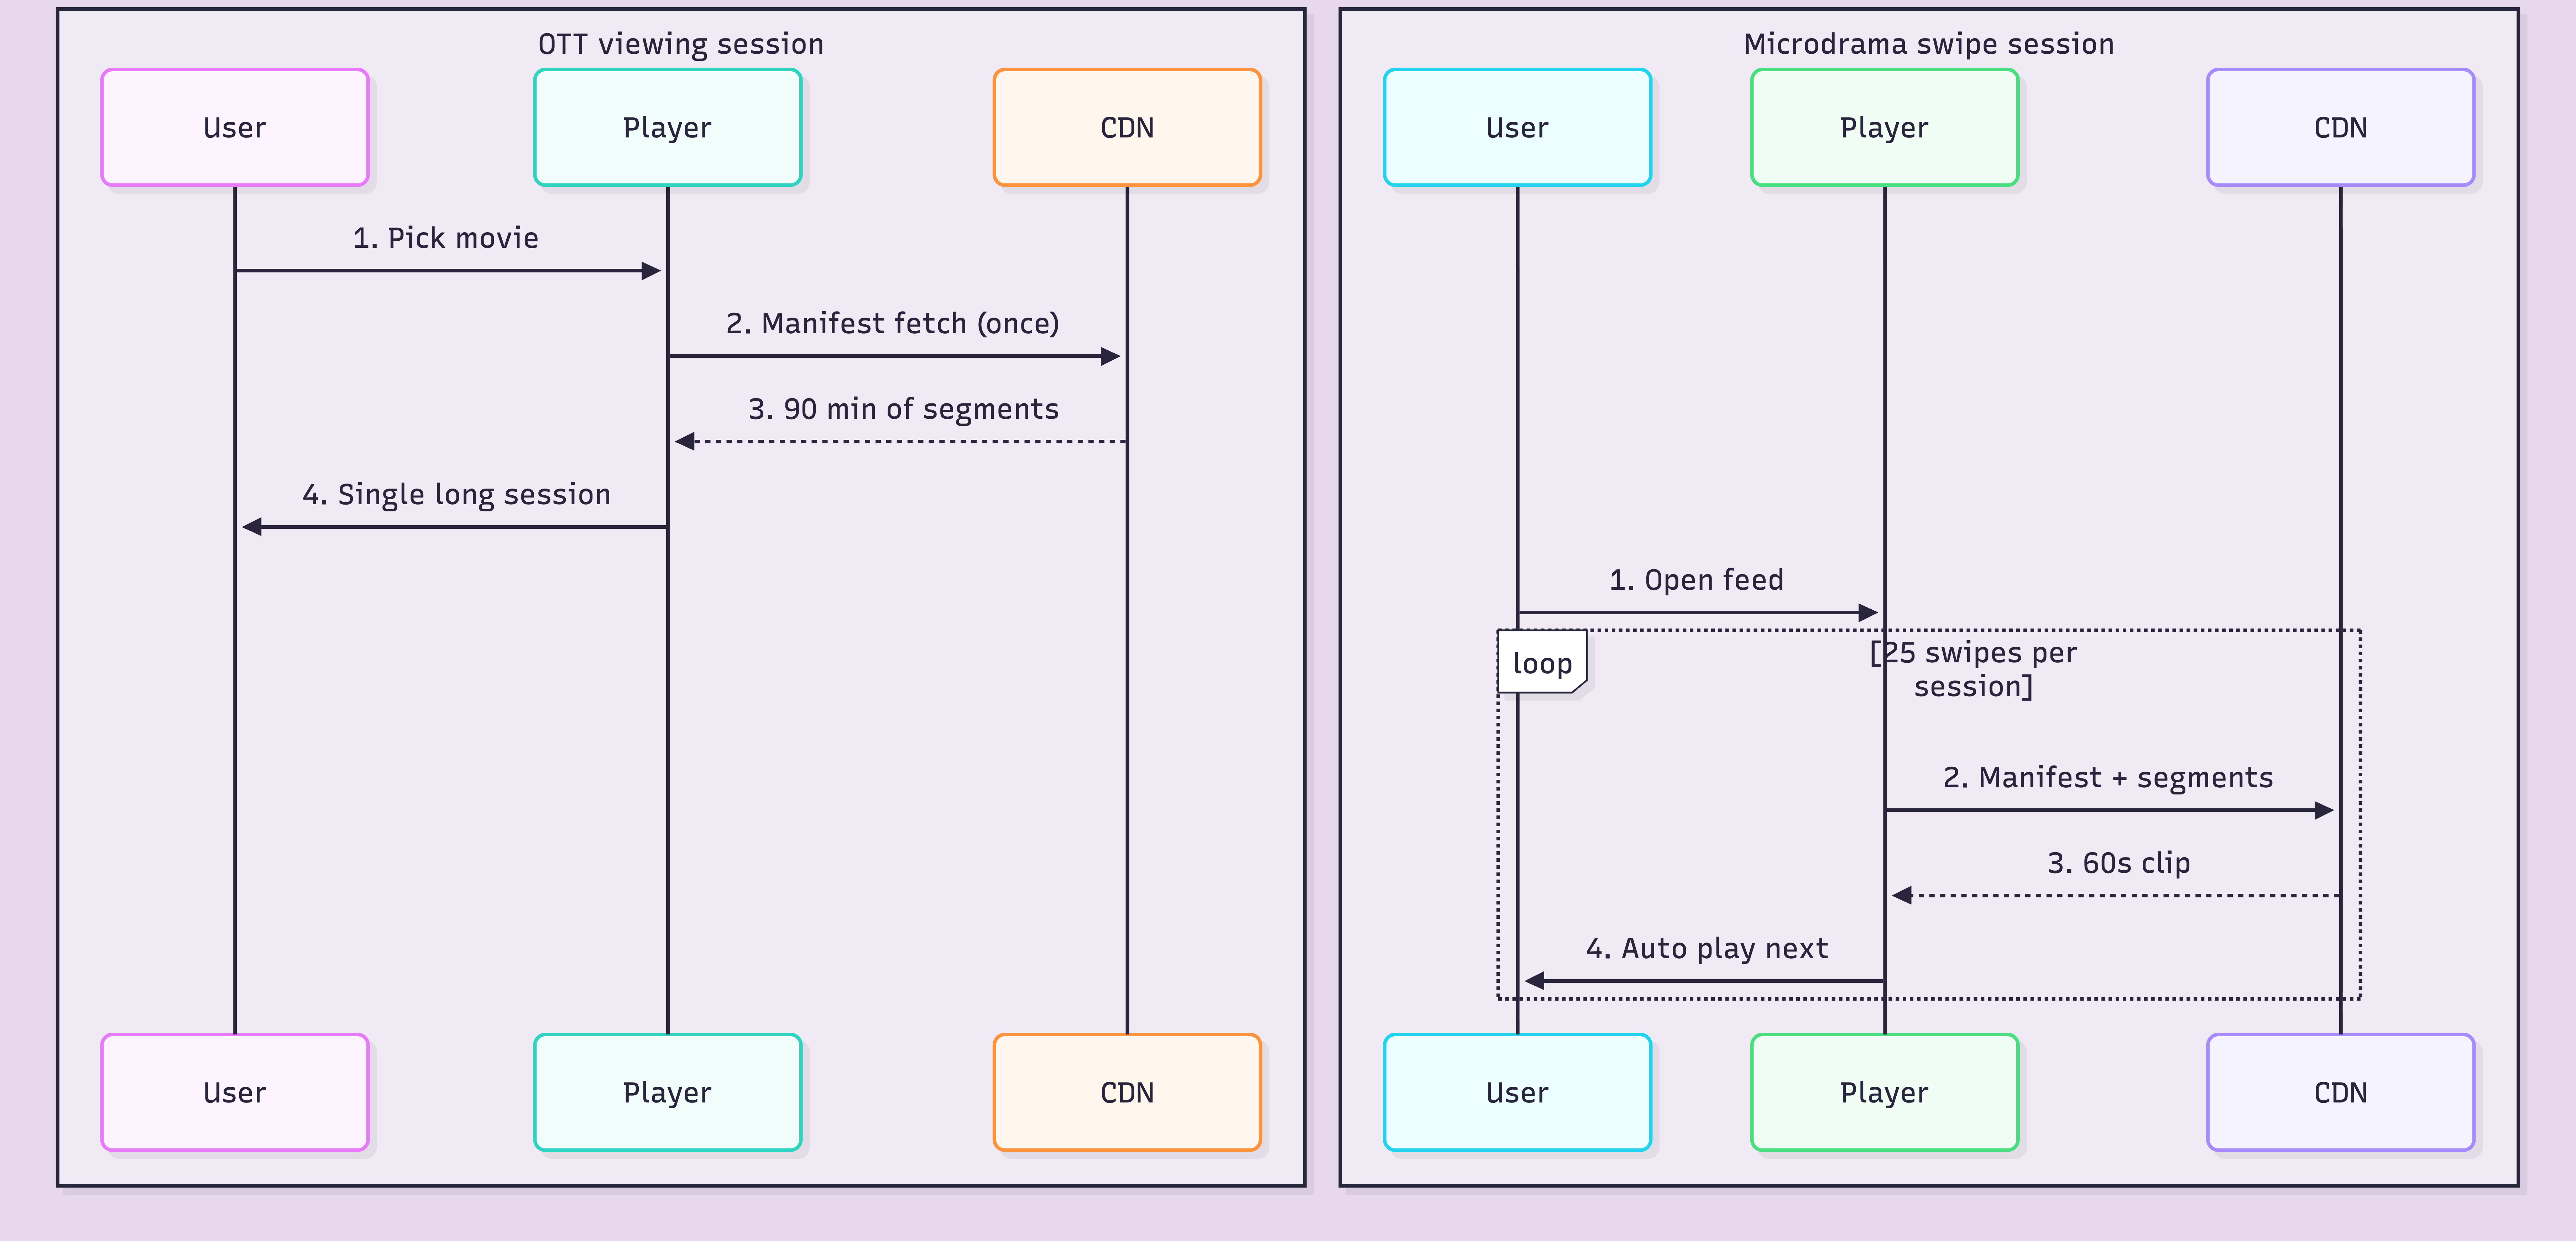
This is where the two workloads truly split. Both push roughly the same total minutes through the CDN at 1 million MAU. The difference is what each minute looks like at the network layer.
An OTT viewer opens the player once, picks a 90-minute movie, and streams it as a single long HLS session. The CDN sees one manifest request, a few hundred segment requests, and a clean exit.
A microdrama viewer opens the player 750 times a month. Every swipe is a brand new playback session. Every session triggers a fresh manifest fetch, segment prefetch, and analytics ping. Same bandwidth, 25 to 100 times the request count.
Microdrama viewers in India watch a median of 3.5 hours of short-form content per week (Ormax Media, 2026). Multiply that by a million users and the request graph stops looking like video and starts looking like a high-traffic API.
Player and analytics overhead
OTT analytics care about viewer experience scores, rebuffering ratio, and time-to-first-frame. The events are coarse: one play, one pause, one quality switch, one ended event per session. At 1 million MAU and 8 hours of watching per user, you generate roughly 30 million view events per month.
Microdrama analytics care about completion rate, scroll velocity, and per-clip drop-off. Every swipe is a discrete event. Every clip start, complete, skip, and like fires its own ping. At 1 million MAU and 750 clip plays per user, you generate roughly 750 million view events per month.
| Metric | OTT | Microdrama |
|---|---|---|
| View events / month | ~30M | ~750M |
| Event focus | QoE, rebuffer, startup time | Completion, scroll, swipe |
| 100K free analytics tier covers | Toy accounts only | Almost nothing at scale |
| Per-view billing impact | Manageable | Dominant cost driver |
Most managed video platforms bill analytics per 1,000 views above their free tier. At 750 million events per month, that one line item alone can rival the delivery bill. This is the silent killer of microdrama unit economics.
We include FastPix Video Data free for the first 100,000 views per month. That covers a lot of OTT projects. It does not cover microdrama at scale, and we are honest about that. Teams running microdrama workloads should model the per-view rate before they commit to any vendor.
Live streaming surface
OTT platforms often add live channels for sports, news, or premieres. That brings RTMPS or SRT ingest, low-latency HLS packaging, and DVR storage on top of the VOD bill.
Microdrama almost never streams live. The format is built around scripted, vertical short clips uploaded as VOD. The live line item is zero. One less moving part, one less invoice.
What this looks like at 10x scale
We stress-tested both workloads at 10 million MAU. The line item that breaks first is the one that should drive your platform choice.
| Stress test (10M MAU) | OTT first to break | Microdrama first to break |
|---|---|---|
| 1st bottleneck | Delivery cost (~4.8B min/mo) | Per-view analytics (~7.5B events) |
| 2nd bottleneck | Storage growth (catalog never shrinks) | Manifest request rate at the edge |
| 3rd bottleneck | Premium encoding for new releases | Webhook and event processing pipeline |
OTT scales by buying more bandwidth. Microdrama scales by buying more event throughput. Two completely different procurement conversations, even though both rate cards say "video API" at the top.
How Micro Drama hit 10 million installs without OTT economics
The Micro Drama app is one of the breakout titles in the format. The Play Store lists 10 million plus installs and 4.75 stars across 159,697 ratings as of 2026. Inside the catalog: Korean dramas, Chinese dramas, romance shorts, all delivered in 60 to 90 second vertical clips.
What makes the app a useful case study is what is missing. There is no premium encoding ladder, no DVR, no live channels, no quality score dashboard. The team optimized for one metric only: how fast can a user swipe to the next clip. Every infrastructure choice followed from that question. The encode is single-pass, the player preloads the next two clips, and the analytics pipeline fires per-swipe events at high volume.
The lesson for builders: if you copy an OTT cost stack onto a microdrama workload, you will pay for capacity you do not need (premium encoding, multi-year retention) and underprovision the things you do need (event throughput, request handling). Micro Drama got to 10 million installs by refusing to inherit OTT defaults.
Where most managed video platforms get this wrong
Most managed video platforms publish one rate card. Encoding per minute, delivery per minute, analytics per 1,000 views, storage per GB. The card looks neutral, but it is built for OTT. The pricing assumes a few thousand long titles and viewers who watch for 30 minutes at a time.
Drop microdrama into that rate card and the analytics line goes vertical. We see this when teams move from a side-project microdrama prototype to a real launch. The bill scales linearly with delivery and exponentially with view events. By the time the founder notices, the per-user economics are already underwater.
We built FastPix as a single API for video, but the pricing is split by what you actually use: encoding per minute, delivery per minute, and analytics free up to 100,000 views before usage-based pricing kicks in. This separation matters because microdrama and OTT pull on different levers. A platform that bundles them into one number is making a bet, and the bet usually goes against you.
The honest stance: any vendor that quotes a single per-MAU price for "video" without asking how many view events you generate is overcharging one workload to subsidise the other. Ask the question before you sign.
How to price your own workload before you commit
Three numbers tell you which side of the comparison you are on. Gather them before you talk to any vendor.
- Average session length and clips per session. Long sessions point to OTT-shaped delivery costs. Short clips point to event-shaped costs.
- Per-view event count per user per month. Count every play start, quality switch, completion, and skip. Multiply by your projected MAU. If the answer ends in "billion," you have a microdrama workload regardless of what marketing calls it.
- Hot vs cold storage ratio. If you keep titles hot for years, your storage line is OTT-shaped. If your hot window is two weeks, your storage line is microdrama-shaped.
Run both workloads through any vendor's calculator with these three inputs. The line items that dominate will tell you whether the rate card was built for you or against you.
FAQ
Is microdrama infrastructure cheaper than OTT?
At the same MAU, the total bill is often similar in raw dollars. The breakdown differs. OTT spend concentrates in delivery and storage. Microdrama spend concentrates in per-view analytics and request handling. Whether one is cheaper depends on which line items your vendor charges for.
Why does CDN cost more for short clips?
Bandwidth is similar, but request count is 25 to 100 times higher because each swipe is a fresh playback session. CDNs that bill per request, or platforms that bill per view, see microdrama as an expensive customer.
How does storage work differently for microdrama?
Microdrama uses a 7 to 14 day hot window before clips move to cold storage or get deleted. OTT keeps catalog titles hot for years. Microdrama wins on storage. OTT wins on bandwidth amortization across long viewing sessions.
Which pricing model is better for short-form video?
Pricing that splits encoding, delivery, and analytics into separate per-unit charges is friendlier than bundled per-MAU or per-view pricing. Per-view analytics scales with swipe count, which is the killer line item for microdrama.
Can one platform serve both OTT and microdrama?
Yes, technically. A single video API can ingest, encode, and deliver both formats. The thing to verify is whether the rate card prices the two workloads separately, or charges OTT rates for microdrama traffic.